Astronomy Dashboard
The Astronomy Dashboard is a reinvention of the Windows Task Manager and is meant to improve the capabilities of the I.T. professional by providing them with tools to greatly simplify the management of their PC, Server, or Tablet.
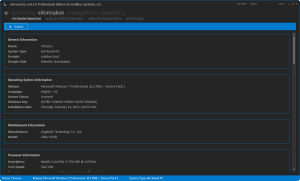
The System Information section covers all essential static system information in Astronomy. Unlike the default Windows offering, Astronomy shows:
- Windows Installation Date, Windows Key, and Licensing Status.
- Processor Core breakdown and Hyper-threading / Hyper-transport setup.
- Maximum memory capabilities and RAM slot breakdown.
- Disk Drive partition breakdown.
- Video card details.
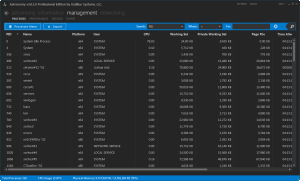
The Processes section provides all process management functionality in Astronomy:
- Open File Location: opens the location of the selected process file.
- List Process and Child Process(es): Lists a process and all dependent child processes.
- End Process: Kills a process.
- End Process and Child Process(es): Kills a process and all dependent child processes.
- Attach Debugger: Attaches a debugger to a process.
- Set Priority: Sets the process priority.
- Properties: Opens the extended properties for a process.
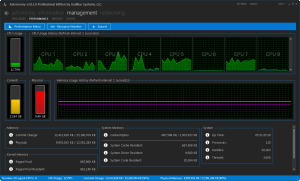
The Performance section gives you a performance view of your CPU’s, Memory, and some basic system stats as well as:
- Adjustable graph views: all in one, 1, 2, 4, or 8 in a row.
- Multiple ways to export data.
- Adjustable data refresh speeds between 1 and 5 seconds.
- Access to Resource Monitor.
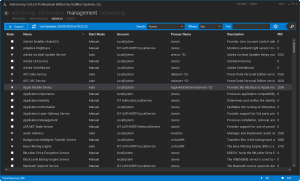
The Services section shows the list of all Windows Services:
- Ability to manage service state.
- Capability to navigate to the related process.
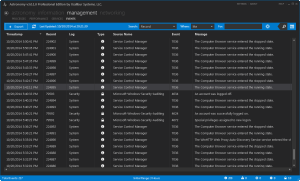
The Events section shows the list of Application, System, and Security events:
- Shows Application, System, and Security logs from ranges between 3 and 72 hours.
- Expanded event details.
- Quick search capabilities to Microsoft Support, Technet, and EventId.Net.
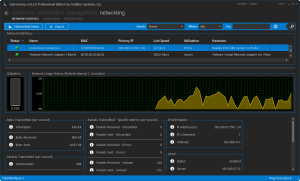
The Network Statistics section gives you a performance and real-time measurement view of your Network interfaces:
- Individual graphs and details for each network interface.
- Adjustable graph views: all in one, 1, 2, 4, or 8 in a row.
- Multiple ways to export data.
- Adjustable data refresh speeds between 1 and 5 seconds.
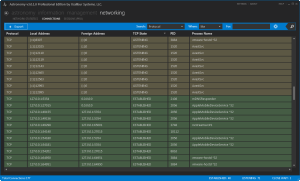
The Connections section shows the list of open ports and connections.
- Detailed connection information including where in the TCP diagram the current state sits.
- DNS information related to the connection.
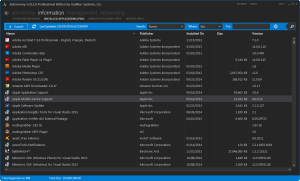
The Installed Applications section shows all installed application in Windows.
- Shows more applications that your would see in Windows.
- Allows the change and removal of your installed applications.


